( well - it may also be useful for users of other GPS tracking Apps)
I bought myself a new Heart rate monitor which connects to Runkeeper - and Runkeeper calls out things like average pace and HR to me as I run. Runkeeper also sends the run stats to the Runkeeper website at the end of a run.
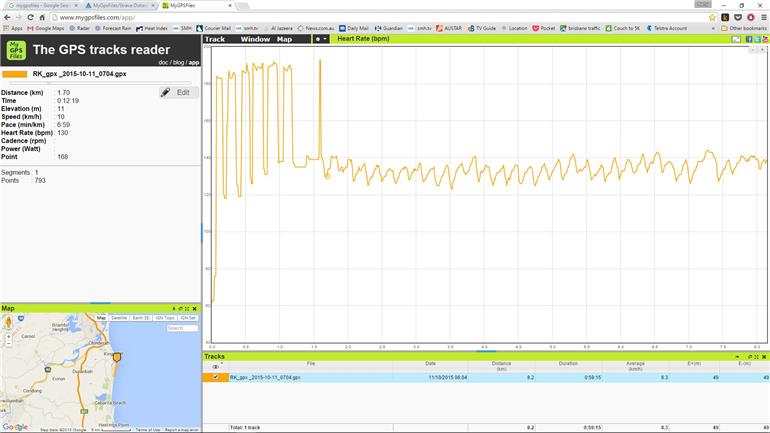
BUT - I have found the Runkeeper website to be a little unsatisfactory -- graphs of elevation, pace and HR are quite small with no scaling along the edge of the graphs. All these graphs give me is an average for the entire run. I wanted to "analyse" my HR more closely - but to do so I needed to somehow utilise the stats so that they are more "readable". At the bottom of each Runkeeper webpage, you can export the run to either "Google Earth" or "GPX" format. I suspected that the GPX file format may be useful somehow -- and found this website mygpsfiles.com/app/ You can open a previously exported GPX file ( stored somewhere on your PC ( Windows only?) ) at this website and the resultant pace/HR/speed/elevation data can be displayed in a large size as per the pic above. Now I can examine what my heart was doing in more detail - I can immediately see that I need to use some electrode gel in future -- but now I can see clearly what max and min HR's my heart was doing (when running 60/30 run/walk at an average pace of 7:15 mins per Klm. ) The largest panel in the pic can be manipulated to display whatever function you wish to see more clearly