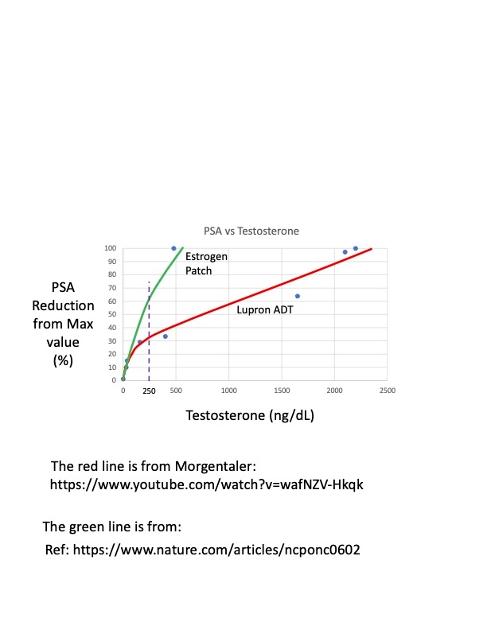
This is a plot of % reduction in PSA from a Maximum Value versus Testosterone, for two different datasets: Estrogen Patch and Lupron ADT.
Both curves (red and green lines) show a linear response starting from (0,0), up to about 200-250 ng/dL. Then, the lines curve over to a lower slope (especially for the Lupron ADT dataset).
What is interesting is that both curves start to roll-over at roughly around 250 ng/dL, which equals the same value from Morgentaler's Saturation Model. However, it also indicates that the Saturation Model may have a non-zero positive slope for T > 250 ng/dL. More data is needed to verify this.
The assumption that a PSA value is proportional to Prostate Growth rate may not be correct.
Also there there is a significant difference between the two curves at T > 100 ng/dL, which could be (1) a problem with normalization of the maximum PSA values, or (2) a fundamental difference in behavior between Lupron ADT and Estrogen Patch therapy. I don't have access to the raw PSA kinetics data from Ockrim's paper, unfortunately.
The red line is from Morgentaler's data (Lupron ADT):
youtube.com/watch?v=wafNZV-...
The green line is from Ockrim (Estrogen Patch data):