Five-year results for the iFCG regimen: first-... - CLL Support

CLL Support

22,532 members38,709 posts

Five-year results for the iFCG regimen: first-line treatment of CLL patients with mutated IGHV and without del(17p)/TP53 mutation

bennevisplace profile image
16 Replies

Published 4 months ago, journals.lww.com/hemasphere... is an update of the Phase 2 study S149, initiated in 2017 and previously reported here in "Novel Combos Are Shaking Up the CLL Landscape but FCR still has its place" healthunlocked.com/cllsuppo...

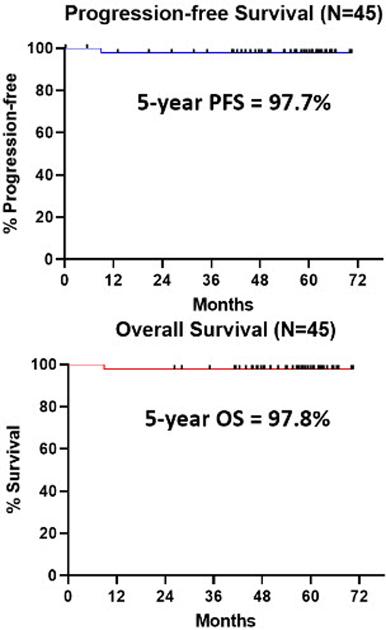
The update reports outcomes with a median follow-up of 56.8 months. The PFS and OS are, as depicted, very high, even allowing for favourable age profile (25-71, median 60) and CLL genetics (100 % IGHV mutated, 69% del 13q). The PFS and OS curves reflect one patient death (from heart failure).

Summary/Conclusion: The iFCG regimen, using only 3 cycles of chemotherapy (as opposed to 6 cycles of chemoimmunotherapy) achieves a very high rate of U-MRD in previously-untreated pts with CLL with IGHV-M CLL. No pt had disease progression with a median follow-up of close to 5 years. The 5-year PFS is 97.7%; this is favorable compared to 5-year PFS of ≈65% with FCR (CLL10), ≈70% with ibrutinib (A041202 trial), and 81% with ibrutinib (RESONATE-2) for IGHV-M CLL. Not unexpectedly, MRD recurrence during follow-up correlated with MRD positivity by NGS during therapy.

I have no doubt that these results are easily good enough to justify a phase 3 study enrolling many more patients. Will it happen? I guess it depends on whether potential sponsors see something to be gained, or lost. A phase 3 study would certainly burn a heap of cash. A "good" result could widen the market, or more likely could see a flagship product nibbling away at its own market share ("Stop taking Ibrutinib after a year??? after our lawyers worked their butts off to get the patents stretched out into the 2030s?"). Anyway, who wants to be associated with old-hat chemo drugs? Well, maybe some CLL patients do.

Written by
bennevisplace profile image
bennevisplace
To view profiles and participate in discussions please or .
Read more about...
16 Replies
johnliston profile image
johnliston

What about adverse Events?

john

bennevisplace profile image
bennevisplace in reply to johnliston

This paper appears to have been made to accompany an oral presentation and as such is brief and to the point. It states:

The sole event noted on both the PFS and OS curve is a pt death from heart failure.

One pt developed therapy-related MDS; this pt is being monitored for 38+ months without any therapy for MDS with normal blood counts.

Another summary of the same study at the same stage obroncology.com/article/tar... says a bit more:

Toxicities observed in the study were among those commonly associated with ibrutinib, including atrial fibrillation and joint pain, as well as with chemoimmunotherapy, such as low blood counts and myelosuppression.

may04cll profile image
may04cll

What has become of the data from the IFCR trial ?

bennevisplace profile image
bennevisplace in reply to may04cll

The study sponsor retains the primary data, and researchers have access.

LeoPa profile image
LeoPa

,,wow , how long do 3 cycles take?

bennevisplace profile image
bennevisplace in reply to LeoPa

🔎👴

bennevisplace profile image
bennevisplace in reply to LeoPa

I'm guessing 3 x 28 days of iFCG, because 6 x 28 days is a full course of FCR.

LeoPa profile image
LeoPa in reply to bennevisplace

That would be perfect if so. Quite affordable compared to the price of current treatments.

bennevisplace profile image
bennevisplace

Prize for the person who figures out why the 5 year PFS = 97.7 % and the 5 year OS = 97.8 %

LeoPa profile image
LeoPa in reply to bennevisplace

0.1% progressed but survived.

bennevisplace profile image
bennevisplace in reply to LeoPa

45 patients, 0.1% would be 0.045 of a patient progressing, which is about right.

The text says no patient had disease progression, i.e. 0.000 of a patient, so I can't award you the prize Leo, sorry.

LeoPa profile image
LeoPa in reply to bennevisplace

That's the patient that halfway progressed and they rounded him down to zero 😁

bennevisplace profile image
bennevisplace in reply to LeoPa

Nice try Leo, consolation prize for persistence 🥥

bennevisplace profile image
bennevisplace in reply to LeoPa

See below

bennevisplace profile image
bennevisplace in reply to bennevisplace

Here's my answer to my own question. Open to comments from learned colleagues.

I maintain that both the PFS and OS figures should be 97.8 %. I have two explanations for the 97.7 % figure having arisen, and I wonder that such an obvious error could perpetuate into a paper authored by i.a. some celebrated names.

Back to basics. What are we talking about with PFS and OS?

Progression-free means that at the time of assessment the patient's disease has not returned; the important point being that the measure is binary: either the patient has progressed or the patient is progression-free, for the purposes of the study there is no halfway house.

Percentage Progression-free Survival (% PFS) is the percentage of patients starting the study (45 in this case) who were progression-free (44/45 = 97.7778 %) at the time of assessment (5 years, give or take a few months).

Percentage Overall Survival (% OS) is the percentage of patients starting the study (45) who were still alive (44/45 = 97.7778 %) at the time of assessment (5 years, give or take a few months).

The text of the paper explains that one patient died, and both the PFS and OS plots reflect this at ~10 months. The text also states that no patient progressed, which ties in with the fact that after 10 months the PFS plot remains horizontal.

So where did the figure PFS = 97.7 % come from?

Anyone, after all, can see that the % PFS and % OS in this case must be the same 44/45 = 0.97recurring = 97.8 % to the nearest 0.1 %.

First explanation Someone used a calculator with the display set to 3 or more decimal places, got an answer of 97.777(7...) for PFS and wrote down 97.7. They then left the study for unknown reasons. Someone else, possibly using a different calculator, nailed the figure 97.8 for OS.

Second explanation The study employed a statistician to do lots of analysis, including the simple task of drawing the PFS and OS plots and generating the 5-year % PFS and % OS figures. A typical software package would incorporate a Kaplan-Meier module en.wikipedia.org/wiki/Kapla... A useful estimator, which can account for missing data etc, but maybe it can also introduce small errors like this one - only noticeable because it's such a simple case.

The second explanation seems the more probable, but I prefer the first.

LeoPa profile image
LeoPa in reply to bennevisplace

You really like your math

You may also like...

Progression Free Survival (PFS) post Discontinuation of Ibrutinib in E1912 Trial

An update re the E1912 trial reported at iwCLL this year - \\"patients who stopped ibrutinib for...

Best front-line treatment(non-chemo) for CLL with no 17p deleton/TP53?

treatment naive patients with non-chemo drugs. Anyone doing well on therapies as...

Health Canada approves Ibrutinib plus Rituximab for First Line Treatment of Patients with Chronic Lymphocytic Leukemia (CLL)

the Phase 3 ECOG1912 study (also referred to as E1912) that demonstrated newly diagnosed patients...

UK NICE Approves Ibrutinib +Venetoclax for First Line treatment for ALL Patients from today

access to novel therapies in the UK for younger fitter patients who had no right of access to a...

Does anyone know if the Indian pharmaceutical industry has good result in the treatment of CLL 17p?

country there is no network for CLL, your community generates updated information and a hope...