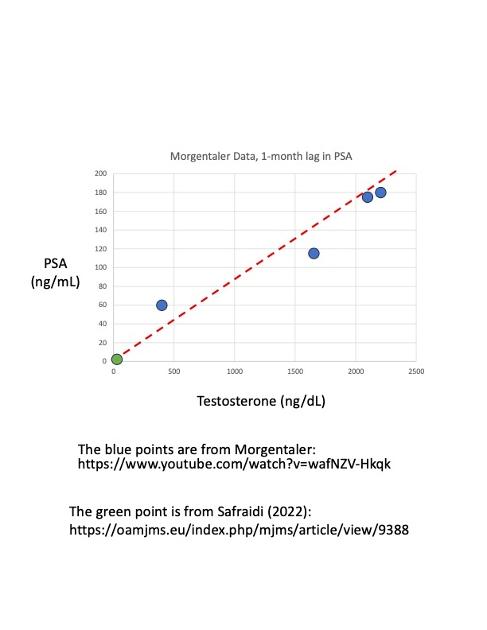
This is a plot of PSA versus Testosterone in men with prostate cancer. The blue points are taken from a YouTube video lecture by A. Morgentaler (2020).
youtube.com/watch?v=wafNZV-...
The green point is from Safraidi (2022):
oamjms.eu/index.php/mjms/ar...
Note the very large range for testosterone...up to 2200 ng/dL and large PSA values up to 180 ng/mL. The linear model holds up well over this large range of values.
The Morgentaler PSA data points are lagged by about 1 month, since its takes about 1 month to respond to a change in testosterone level.
Interestingly, there doesn't appear to be any saturation effect.