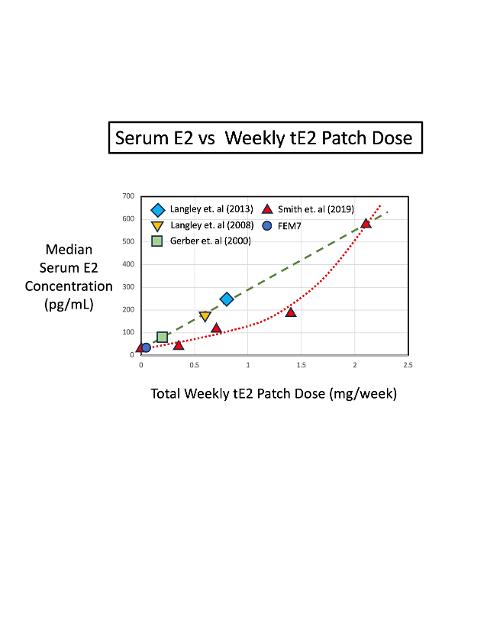
This plot shows the median serum estrogen (E2) concentration (in pg/mL) versus total Weekly Estrogen patch dose (mg/wk) from five different references ranging from 2000 to 2019.
The data set from Smith et. al (2019) is for castrate-resistant prostate cancer men (CRPC), who are not taking ADT.
Overall, the serum E2 concentration increases as the number of E2 patches used per week (Total weekly E2 dose) increases. For reference, the E2 range for a healthy, pre-menopausal woman is [200-400] pg/mL.
There is no evidence of a rollover or saturation in the serum E2 as the applied E2 patch dose increases. In fact, the dataset from Smith et. al (2019) is best fit by a rising quadratic curve (red dashed line), instead of a straight (linear) line.
Differences between the linear fit (green dashed line) and the quadratic fit (red dashed line) may be due to men belonging to different PCa groups (i.e., castrate-sensitive or castrate-resistant).
These curves can be used to titrate the serum E2 concentration to a desired target by adjusting the number of patches used per week. When using a common 100 microgram/24 Hr estrogen patch, then 10 patches per week provides a weekly absorbed dose of 1.0 mg E2 per week.