Up early to beat the heat and I'm back to my local park where it all started for me 3 months ago. The park is located on a hillside and the route around the perimeter is roughly rectangular with the 2 longest sides running across the slope and the 2 shortest sides up and down the hillside. In the winter the park is popular with families tobogganing down the slope and 3 months ago when I started it was a real struggle to run all the way up the hill😂
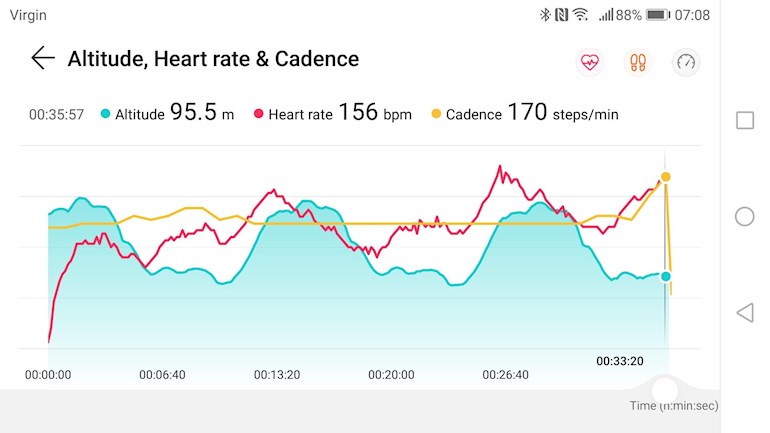
I took a photo of it this morning and to be honest it looks nothing but it does get the heart rate going and I have to slow my pace down to accommodate. Decided to post a screenshot of my health app instead as it looks more intimidating on there😂
The blue line shows the altitude. So I am starting almost at the top of the hill and complete almost 3 laps but only have to run the complete hill twice. The red line shows my heart rate. You can see how it increases to cope with the hill and then drops once the hill is conquered. The yellow line is my cadence ( steps per minute) which I try to keep fairly consistent. My steps are shorter running up the hill and this is where I am losing ground. At the end I tried to put in a bit of a flourish so you can see my cadence and heart rate increasing according. Hope this information is of help to some of you who are trying to interpret their data off their own watches.
I think I'll chose a more flatter route for my next 5K😂
Happy Running Everyone and take care in the heat 🏃😀
5.05K / 36:21 min / 7'12"
