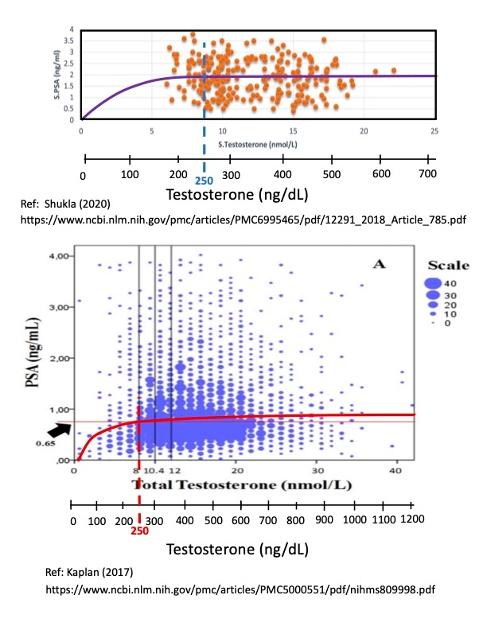
Here are two plots comparing PSA values to Testosterone levels taken from a pair of large data sets.
What is striking is the large amount of scatter in the individual data from both datasets, with factors of 2-6 X deviations from the average (or median) values. The upper plot has N = 255 data points (Shukla, 2020), and the lower plot has N = 2967 data points (Rastrelli, et. al, 2013, reproduced in Kaplan (2017)).
Both plots have been fit with an average linear-flat curve that is based on Morgentaler's Saturation Model. At the theoretical limit of zero testosterone, there is no "food" for feeding prostate cancer cells, and the corresponding PSA value is theoretically zero, which anchors the curve fit the origin at (0,0).
Note that the linear regime only appears to be present for T 250 ng/dL (as indicated by the vertical dashed lines). Morgentaler wrote that the rollover point was "from 240-250 ng/dL", which agrees very well with the observed saturation points of these two data sets.
The are three key takeaways:
(1) Below about T = 100 ng/dL there is a linear relationship between PSA and testosterone, meaning, for example, that a 50% drop in testosterone implies that there will be a similar 50% drop in PSA (all other factors being equal). This is relevant for castrate-sensitive men who are doing ADT, namely that lower T is better because this will cause a lower PSA;
(2) At T > 250 ng/dL, the PSA becomes "saturated" at a maximum average value of about 0.65 to 1.8 ng/mL, and any increase in Testosterone greater than T= 250 ng/dL will not increase the PSA level any further. This is an important result for castrate-resistant men who want to supplement their T level (for example, from 200 to 1000+ ng/dL) after completing their ADT treatment cycle. According to this data, supplementing T levels from 200 to 1000+ ng/dL will have no effect (no increase) on their PSA value.;and finally
(3) There is tremendous scatter in the PSA data (factors of 2X to 6 X).
Bob