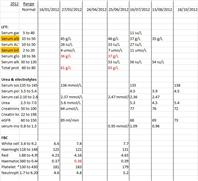
Example of how I type up my blood test results into a Microsoft Excel spreadsheet. The red ones are 'out of range' to be brought to my consultants attention when I next see them in clinic.
Spreadsheet picture: Example of how I... - British Liver Trust
Spreadsheet picture

Written by
Bolly
To view profiles and participate in discussions please or .
Read more about...
4 Replies
•
Oh dear, its come out teeny tiny. The left column is the name of the test, i.e Serum albumin. The next column which in this picture has merged with the name of the test, sorry, is the 'normal' range i.e. 35-50g/L for serum albumin.
Then the next columns from left to right are my results in date order (date at the top of the colum). Results in red (I think you can just about see 4) are when they are out of range.
Its important to record the unit value, i.e g/L or mmol/L or iu/L, as different labs use different units.
Makes sense to me. Good tool.
Thanks Bolly thanks for all your help
I have made up a similar spreadsheet and find it an invaluable tool. Great minds think alike. I get a print out from my doctor and keep it updated. X
Not what you're looking for?
You may also like...
Acute temperature and pain 3 months after transplant.
I thought everything was going well but at 4am this morning I woke in agony with a sharp pain on my...
Fatty liver and nosebleeds
Hi, i have had m.e for 9 years and the only thing wrong in my bloods At the beginning was my ALT...
Dla - re liver transplant
Hi I received my Dla prior to my liver transplant which I got in 2015. I didn't know I had to...
Nervous about getting fibroscan...again
So next month will be my schedule test again for fibroscan. This is my 2nd time, as i was...
Getting so tired of it all
Hi All,
I'm sure most of you all have read my posts of my struggles with alcohol, since I lost my...