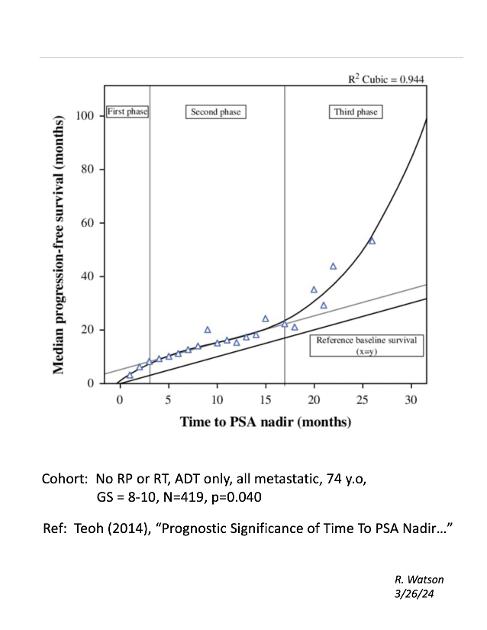
This graph from Teoh (2014) plots the relationship between Time to PSA Nadir (months) versus Time to Progression (months) (i.e., Progression Free Survival).
Cohort: ADT monotherapy (No RP or RT), all metastatic patients, median 74 y.o., GS = 8-10, N=419.
A cubic spline curve fit matched the data points very well, with a high correlation coefficient, R^2 = 0.944, and a low p = 0.040.
During the so-called "Second Phase", the slope of the line closely matches a reference baseline survival line (x=y) with a slope = 1:1. This means that the Time to Progression is approximately equal to the Time to PSA Nadir + a vertical offset = 5 months (y = x + 5).
From the paper: "Progression was defined as at least two serial rises in PSA (taken at least 1 week apart) from its nadir level. Initiation of any secondary hormone treatment for rising PSA also was considered as a progression event."
What is interesting and unexpected is the "Third Phase" (where the Time to PSA Nadir is greater than 17 months). In this "Third Phase", the Time to Progression is favorably 2X to 3X times longer than the Time to PSA Nadir.