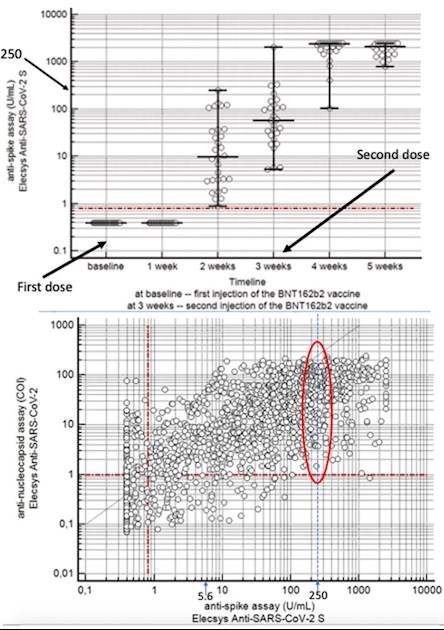
Just for fun, I’ve extracted two figures from a paper reporting on levels of anti-SARS-CoV-2 antibodies to the Spike protein, to give you something to compare your own values to. I am making no attempt to explain the paper from which these figures were extracted, which is basically testing reagents. Nor is any data provided about the level of protection afforded by any particular antibody level. The purpose is simply to provide some reference for where 250 U/mL lies on the scale of antibody levels.
Figure 2 (top) is a plot of anti-spike antibody as measured in units/mL (U/mL) on the Y axis, and the time post-vaccination measured in weeks on the X axis, for 34 individuals who have never tested positive for COVID-19, and who have been vaccinated with the Pfizer vaccine.
The Y axis is plotted on a log scale and you can see that there is a very large range of anti-spike antibody concentrations evident two weeks after the first vaccination, and that following the second vaccination the titers rise significantly in all tested individuals.
The LabCorp semiquantitative assay that is being used in the LLS study (NCT04794387) does not determine antibody levels greater than a 250 U/mL cutoff point which I have marked on the Y axis of the plot. This study which uses a quantitative assay also reports the antibody levels as U/mL which are units based on how much a sample needs to be diluted before antibody binding is no longer detected. A quantitative assay takes longer, uses more reagent, and is thus more expensive.
Figure 1(bottom) is a scatter plot of 3033 serum samples collected from non-vaccinated individuals, some of whom have had COVID-19 in the past and some of whom haven't, comparing the levels of anti-nucleocapsid antibodies to anti-spike antibodies. In this plot anti-spike antibody is again measured as U/mL, this time on the X axis, and anti-nucleocapsid antibodies are plotted on the Y axis, measured by a cut-off index (COI; signal of sample divided by cutoff). The assay for the anti-nucleocapsid antibodies was different, and hence the difference in units. I’ve circled the samples that had ~250 U/mL of anti-spike antibody so that you can compare the value to the vaccinated individuals in Figure 2. Take note that the X and Y axes are both on a log scale and that the red dotted lines show the cut-off levels, ie anything below those lines is considered negative.
sciencedirect.com/science/a...
gardening-girl