Testosterone and PCa - 2: This plot... - Prostate Cancer N...

Prostate Cancer Network

4,955 members3,087 posts

Testosterone and PCa - 2

janebob99 profile image
0 Replies

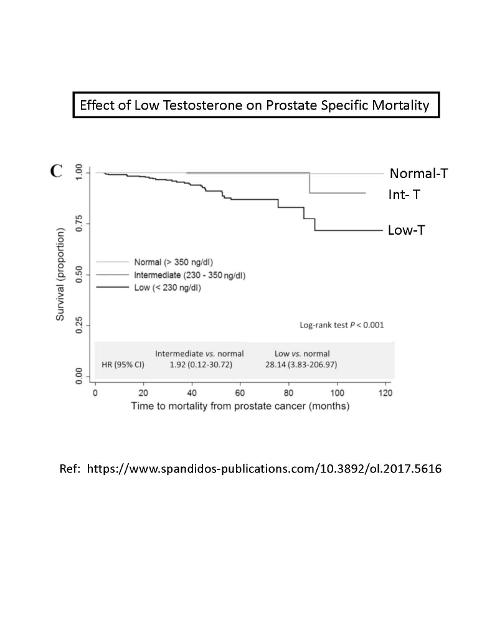
This plot shows a Kaplan-Mier Prostate Cancer Mortality Survival plot for three different levels of baseline testosterone: Low-T, IntermediateT, and Normal-T.

The best survival is for men with Normal testosterone levels at baseline, and the worst survival is for men with low-T.

REF: spandidos-publications.com%...

Written by
janebob99 profile image
janebob99
To view profiles and participate in discussions please or .
Read more about...

You may also like...

Testosterone and PCa Risk - 3

with a testosterone of 1000 ng/dL. These plots also show that for hypogonadal men, with T-levels =...

Low Testosterone reduces Survival by a huge amount.

This plot compares prostate cancer specific mortality probability versus time for two different...

Low testosterone is associated with extremely poor survival metrics, post-ADT.

Failure for two different levels of testosterone: Low and Normal. The low testosterone has a...

Recovery of Testosterone

Lupron my testosterone is now in the low end of normal and my PSA is <0.01. My baseline...

Relevance of Testosterone Levels

other men. Interestingly, men with very low levels of testosterone who did get prostate cancer 57%...