Official Statistics Liver disease prof... - British Liver Trust

British Liver Trust

36,594 members17,991 posts

Official Statistics Liver disease profiles, July 2023 update - published 4 July 2023

Richard-Allen profile image
6 Replies

For those of you who may be interested, the latest liver disease profiles for England were released this morning at 9:30 am, by the Office for Health Improvement & Disparities.

It will come as no surprise to find that liver disease has increased exponentially.

These latest set of figures incorporate the first full year of the COVID-19 pandemic.

Main findings

This update shows:

• the number of admissions to hospitals where the primary diagnosis was liver disease rose by 22.0% in the financial year ending 2022 from 82,290 compared to 67,458 in the financial year ending 2021 (the first full year of the COVID-19 pandemic)

• there was a 4-fold difference in admission rates for liver disease between the counties and unitary authorities (UA) with the highest and lowest rate 282.0 per 100,000 population in Nottingham and 63.6 per 100,000 population in Wokingham in the financial year ending 2022)

• at a regional level, overall rates of liver disease admissions to hospitals remain highest in the north of England with the North East having the highest rate of 190.1 per 100,000 population in the financial year ending 2022.

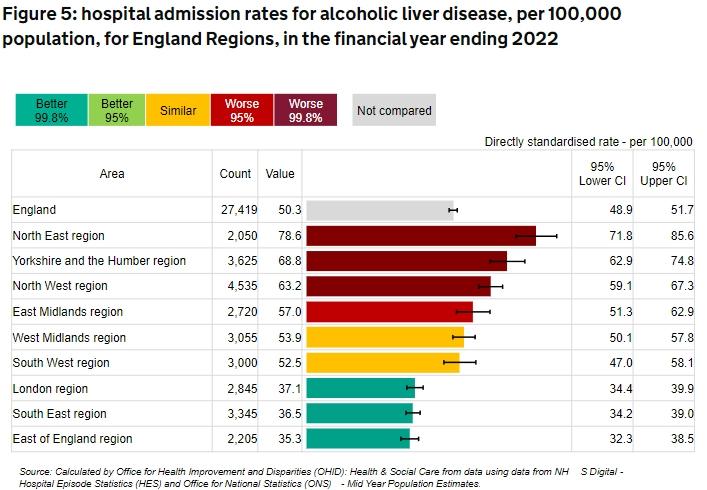
• the number of admissions to hospitals where the primary diagnosis was alcoholic liver disease rose by 11.7% in the financial year ending 2022 from 27,419 compared to 24,544 in the financial year ending 2021 (the first full year of the COVID-19 pandemic)

• there was an 11-fold difference in admission rates for alcoholic liver disease between the counties and unitary authorities (UA) with the highest and lowest rate (145.3 per 100,000 population in Leeds and 13.4 per 100,000 population in Wokingham in the financial year ending 2022)

In the financial year ending 2022, there were 82,290 hospital admissions due to liver disease in England, a rate of 150.6 (148.3-152.9) per 100,000 population. This compares with 67,458 admissions in the financial year ending 2021 (the first full year of the COVID-19 pandemic). The number of hospital admissions due to liver disease has increased by almost 47% compared to 10 years ago, in the financial year ending 2012, when there were 56,143 admissions.

More information can be found here: gov.uk/government/statistic...

Written by
Richard-Allen profile image
Richard-Allen
To view profiles and participate in discussions please or .
Read more about...
6 Replies
Millie09 profile image
Millie09

Hi Richard, hope you are well .Very interesting post , some reads that doesn't suprise me really when the pandemic started and lockdown was in force ,I personally know of several friends and family that started drinking in the day to combat boredom some then stopped when lockdown was eased but a couple were used to that day time/ and night time drinking so that caused them health issues long term

But am I right in saying as the chart above shows England as a whole down by a small percentage? Or am I seeing it wrong

Linda

Richard-Allen profile image
Richard-Allen in reply to Millie09

Hi Linda, yes your right, Covid saw a change in peoples drinking habbits. Drinking at home became the new norm, Over 150 pubs in England and Wales have shut down in the first three months of 2023.

Have a look at the link I posted as this shows a better story. I just wanted to draw peoples attension to the stats. The North East still has the highest morbility rate when it comes to Alcohol-related liver disease.

Millie09 profile image
Millie09 in reply to Richard-Allen

Thank you Richard, yes I shall go look on the link you supplied. Many thanks

Linda

Millie09 profile image
Millie09 in reply to Richard-Allen

I find it interesting that compared to EU countries that England is the worse its actually higher compared to a decrease in Europe.. yet you would think different really with all the holiday destinations and city's.. would be good to find out why this was .

user2021a profile image
user2021a

Thanks for the figures and link. Found one of the comments towards the end interesting

Liver disease is almost entirely preventable with the major risk factors: alcohol, obesity and hepatitis B and C accounting for up to 90% of cases.

For me it had the same prejudiced view that most people hold. As one of the 10% I get especially sensitive to this but equally don’t think it’s a helpful comment for anyone suffering from liver disease.

As with most statistics as more people become aware of the problem and people start taking note, more instances and cases are recorded, this can look like a massive increase whereas it is just more accurate recording, we will see in future if the stats continue to increase or decrease, but agree with Millie, still encountering people who think it is clever to drink, show pride at drinking and won't listen when you mention the damage it can cause your liver.

Also agree with "user" I have had that stereotyping stigma that because I had liver disease it must be alcohol related.

UK need to move away from the culture of drinking to the culture of not drinking and living more healthily.

You may also like...

Alcohol deaths highest for 20 years in England and Wales

19.6% increase compared with 2019 (6,209 deaths; 11.0 per 100,000 people) and the highest annual...

Must Watch - ITV – “Tonight” 7:30 – 8:00pm “Are you Drinking too much?”

had liver disease by the age of 25. He's now five years sober and his liver is no longer......