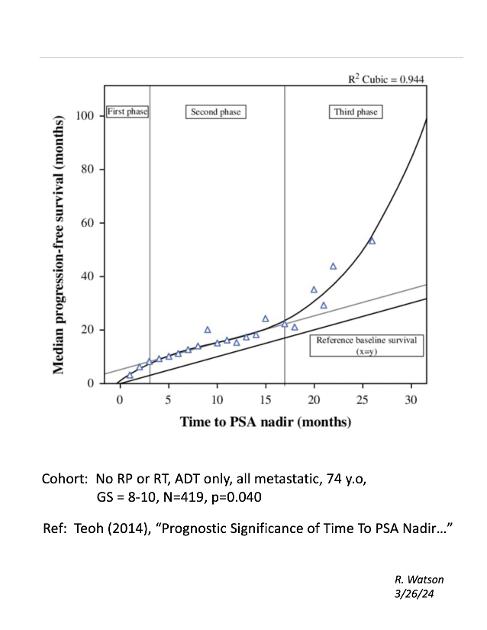
This graph from Teoh (2014) plots the relationship between Time to PSA Nadir (months) versus Time to Progression (months) (i.e., Progression Free Survival).
Cohort: ADT monotherapy (No RP or RT), all metastatic patients, median 74 y.o., GS = 8-10, N=419.
A cubic spline curve fit matched the data points very well, with a high correlation coefficient, R^2 = 0.944, and a low p = 0.040.
During the so-called "Second Phase", the slope of the line closely matches a reference baseline survival line (x=y) with a slope = 1:1. This means that the Time to Progression is approximately equal to the Time to PSA Nadir + a vertical offset = 5 months (y = x + 5).
From the paper: "Progression was defined as at least two serial rises in PSA (taken at least 1 week apart) from its nadir level. Initiation of any secondary hormone treatment for rising PSA also was considered as a progression event."
What is interesting and unexpected is the "Third Phase" (where the Time to PSA Nadir is greater than 17 months). In this "Third Phase", the Time to Progression is favorably 2X to 3X times longer than the Time to PSA Nadir.
I often think my husband may be an outlier. His PSA continues it's VERY slow decline. Big drop from over 677 to 25 after initial treatment (chemo plus lupron) but still dropping slowly 6 years after that. He's been on Zytiga + prednisone and Lupron since finishing Chemo in Jan/Feb 2018. His PSA has had a very slow decline- just getting below 1 this past year.
One problem affecting attempts to compare situations with this graph is that most of our blood tests have a lower limit for reporting PSA (e.g., they report < 0.1 or < 0.01). Unless I'm missing something, this makes it impossible to pinpoint nadir time or concentration.
For example, I reached PSA <0.1 in 5 months (from 111 at dx), and I've been <0.1 for a little over 5 years. So if my nadir was 5 months, and my current progression free survival since nadir is 60 months, my data point is a big outlier on your graph.
Congratulations on being an outlier! That's wonderful.
I didn't make this graph...I copied it from the paper. Perhaps the cohort is different from your situation? This cohort was only metastatic men with no prior RP or RT....just ADT.
I fit this cohort. My point is I have no way to know when I reach(ed) nadir. While I did reach <0.1 in 5 months, my PSA may have continually decreased for x more months. But I don't know x. All I know is that it's been <0.1 for the last 5 years.
Encouraging article for those of us who took a long time to reach nadir. I started with PSA of 930 (DX May 21) and went to .3 in May of 23. Was at that level for four months and thought that was Nadir. (In October 23 my PSA went to .2 and has been there until my last reading in February and we'll see if it goes down again. (I guess you could call the .3 a false nadir?) I am going to get a graphing program to plot my PSA's. I never get readings down to the hundredth is that something the MO has to request specially from the lab?
Wow...that's a huge change in PSA. Congratulations!!
I think they can do a "microPSA" to get to three digits of accuracy 0.00x.
If you get a plotting program, you may find it interesting to cross-plot PSA on the vertical axis and testosterone on the horizontal-axis, to see if you can replicate Morgentaller's Saturation Curve.
I'd be interested in your plots. You can send them to me at janebob99@lobo.net.
very encouraging. My husbands PSA is still dropping slowly. Started at 7000+. In October 2021. Now at .5 after 29 months on chemo. ADT and Zytiga. We would love to have 100 months after reaching nadir.
Content on HealthUnlocked does not replace the relationship between you and doctors or other healthcare professionals nor the advice you receive from them.
Never delay seeking advice or dialling emergency services because of something that you have read on HealthUnlocked.