Some time ago I wrote an app that models how levodopa levels vary as a result of the medications that we take. This is based on pharmacokinetic values such as the half-life of a drug.
To use it, for every dose that you take per day, you enter the time of the dose, the name of the drug and the size of the dose. The app then draws graphs showing your estimated situation updated every minute.
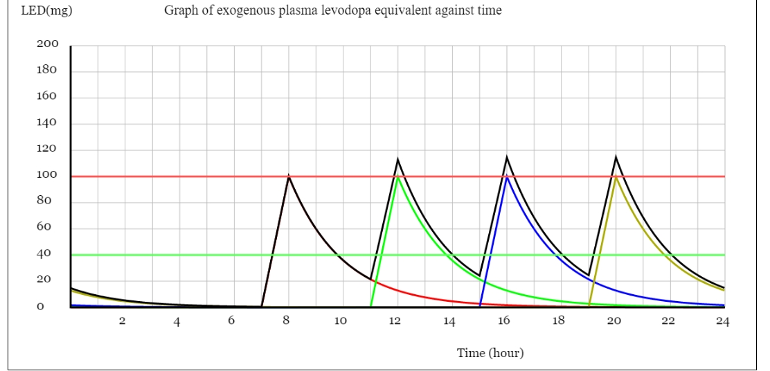
On the attached graph you can see the effect of taking four 100 mg doses of C/L taken 4 hours apart. You get a saw-tooth pattern. If you know your "on"-"off" threshold, you can see the times that you're likely to be "on" (the horizontal green line). And, if you know, your levodopa induced dyskinesia threshold, you can see the times at which dyskinesia is likely to occur (the horizontal red line). You can also see the effect of stacking where the peaks increase slightly during the day. This is due to the new dose being added to what is left of the prevous dose.
To use the app, go to: parkinsonsmeasurement.org/t...
Please remember that this is just a model. It is based on data found in the literature, but this varies from study to study and from person to person. It doesn't take into account such things as food eaten during the day, or gastric emptying. It doesn't look at endogenous (locally produced) dopamine.
John
