I analyse human vital signs data for a job, so I'm always interested in graphs (usually of vital signs).
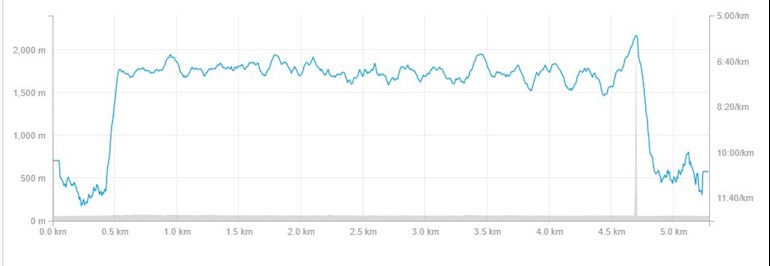
This is the Strava graph of my Week 9 Run 2 run, round the perimeter of Farmoor reservoir.
What I find quite fascinating is the series of ripples, all roughly the same period where the pace varied up and down.
When I first posted about w9r2 I said I thought the body "knew" what was the appropriate pace for it, and that it seemed to be getting faster.
What it looks like here is self regulation - quite unconsciously I was speeding up and slowing down over a period of about a minute, while the average speed was roughly constant. Little bursts of fast running were compensated for by slightly slower times of recovery. The big spike at the end was because I consciously accelerated for the last minute! (Not exactly a Mo Farah sprint finish, but the same idea!)
A colleague of mine who used to run a lot says that the fittest runners show an absolutely flat graph - as if their legs were like a metronome.
For an excessively nerdy final comment - there is a mathematical term for the variations of pace; they are called "limit cycles", and can occur in feedback systems. I think this is what might be happening - when the body can't get enough oxygen to sustain the pace, it compensates by slowing down a bit. I wasn't consciously aware of doing this!
Written by
iain-strachan
Graduate
To view profiles and participate in discussions please or .
I would love to have known what my heart rate, respiration rate and blood oxygen saturation were doing at the time! You can actually get all three from wearing a Pulse Oximeter; it's a small device like a clothes peg that they put on the end of your finger.
Why not add core temperature, skin temperature, hydration, and some not doubt existing formula of o2 in to co2 out which would give an accurate calorie burn.
I think the instrumentation for all that would make it hard to run! 😉. I have tried to get data from a pulseox while riding a bicycle but you get lots of artefacts in the signal. Also a bit tricky using the brakes and gear shifters with the thing on your finger!
I saw someone running recently wearing something I've never seen before. It was a mask going over nose and mouth, and I could see wires coming off it. The wearer looked incredibly athletic so I'm assuming it wasn't a medical necessity but more likely something gathering precise breath related data.
Very interesting. That seems to suggest though that the chap I saw had a respiratory disorder, but he looked like an Olympic athlete. But then I guess(and know from personal experience) that you can't judge by appearance alone.
Lightening it up a bit though. I was half joking when I suggested other metrics that could be measured. Only half joking mind. It would be interesting. But it would also be impinging somewhat on the enjoyment of the activity.
Some of the more advanced watches provide all this info, Iain. My very old Garmin provides my heart rate info, so I can train in specific HR zones if I want to, but I know quite a few runners who examine all their data so they can train better - VO2 max, recovery rate and I don't know what else. Most interesting. Some of it is real time although some is only available after the run. If you look on the Garmin site (or any of the others) you'll see what they can track. Enjoy!
As a Science (Chemistry and Physics) teacher myself. I also enjoy data analysis.
I’ve not heard of Strava before so for that graph what does the y axis measure? Is the m for metres? Or miles? Or minutes? I don’t quite get what’s it’s saying.
But it does look impressive.
I have a fitbit and get a similar looking graph for my heart rate. It’s interesting how much our body subconsciously fluctuates while we run!
Hi, Stacey. The left hand axis is elevation in meters, and is the faint grey trace at the bottom of the graph! I think the reason it doesn't make sense here is there is a spike towards the end, indicating that I zoomed up to 1700m elevation (which clearly is a glitch!). Otherwise the scale would be sensible and you can trace the hills etc for the run (though there weren't here as I was running round the perimeter of a reservoir).
The secondary axis (shown on the right hand side) shows the pace in minutes and seconds per km.
Strava is a free app you can get on iphone or android, and then you also get a web-page where you can get more detailed graphs than are shown on the app.
There is also a professional version that gives you more stats for a small subscription.
A word of warning on Fitbit. I had one for a while, but sent it back as it could drastically underestimate heart rate during high levels of exertion. (e.g. just after a fast cycle ride I measured my heart rate at 113 bpm using my android phone, but the fit-bit recorded 66. In face many bike rides showed an average of 60-80 bpm when the reality was probably 120-130. This could be dangerous if you use the reported figure as indication you can go a lot faster.
Content on HealthUnlocked does not replace the relationship between you and doctors or other healthcare professionals nor the advice you receive from them.
Never delay seeking advice or dialling emergency services because of something that you have read on HealthUnlocked.

")