The T-score on your bone density report shows how much your bone mass differs from the bone mass of an average healthy 30 year old adult. A bone density test is like any other medical test or measurement. The results for the entire population will be distributed around an average score (the mean). A T-score is a standard deviation — a mathematical term that calculates how much a result varies from the average or mean. The score that you receive from your bone density (BMD or DXA) test is measured as a standard deviation from the mean. The manufacturers of the DXA machines have programmed them to use a formula to compute these values.
One standard deviation is equal to a 10-12% difference in bone mass. If you are exactly equal to the peak bone mass of an average 30 year old, you do not deviate at all from the average so your T-score would be 0 standard deviations (SD). If your bones are stronger than the average adult, your bone mass may be +1 or +2 SD indicating that your bones have a mass 10-20% above that of the average 30 year old. If your bones are less dense than the average adult, your standard deviation may be -2 or -3 indicating that your bone mass is 20-30% below that of the average 30 year old.
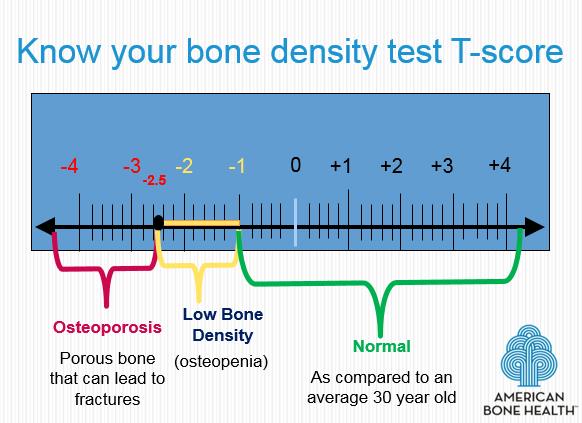
Osteoporosis was defined by the World Health Organization in 1994 as a T-score that is 25% lower than the average 30 year old or 2½ standard deviations below the mean or a T-SCORE LOWER THAN -2.5.
Some people have low bone density. You may hear this called osteopenia. Osteopenia is defined by the World Health Organization (WHO) as 10% to 25% below an average healthy 30 year old adult, or a T-score between –1.0 and –2.5 standard deviations below normal. Having a T-score between -1.0 and -2.5 is not “pre-osteoporosis” or a medical condition, but it is very important for people with low bone density to develop a good plan to prevent bone loss and osteoporosis.
A Z-score compares your bone density to the average bone density of people your own age and gender. For example, if you are a 60-year-old female, a Z-score compares your bone density to the average bone density of 60-year-old females.
NOTE: Any postmenopausal woman should always request her T-score.
A Z-score is helpful in diagnosing secondary osteoporosis and is always used for children, young adults, women who are premenopausal and men under age 50. If you have a very low Z-score (more than 2 standard deviations below other individuals your age), your doctor should consider whether other medical conditions or medications may be causing lower than expected bone density.
Although you may have low bone density when you have your first test, your doctor cannot tell if you have lost bone density or if you have always had lower bone density due to family or medical history. Your peak adult bone mass may have been below that of the average individual. For example, if you have a T-score of -2.5, it is not appropriate to say that you have lost 25% of your bone density unless you had a bone density test when you reached peak bone density. There are lab tests that can help your doctor determine if you are currently losing bone density.